HTML Macro & Themes - User manual

(info) Easily customize your pages and space overview using this macro. Its behavior will be slightly different in overview pages of spaces customized with one of the provided themes vs regular pages.

This macro will fit two purposes in this extension render custom html code into your confluence cloud pages or customize an overview page on a space that is using one of the custom provided themes.

Quick guide

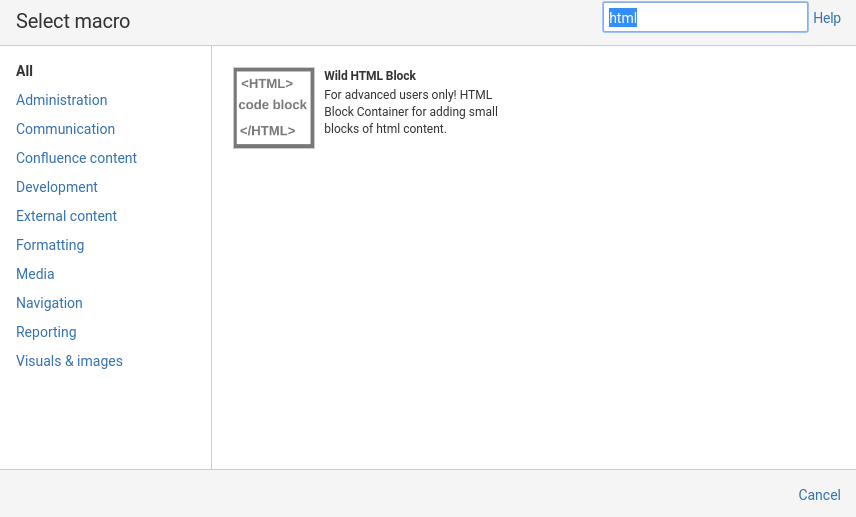
Adding this macro to your pages:

Insert from macros menu

Insert by direct input

Type /html and press enter

How to insert

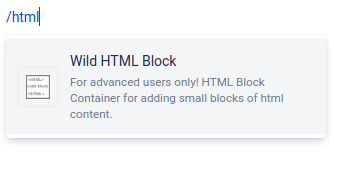
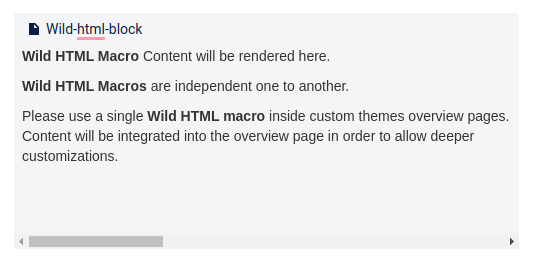
The following content will appear into your page

Edit macro

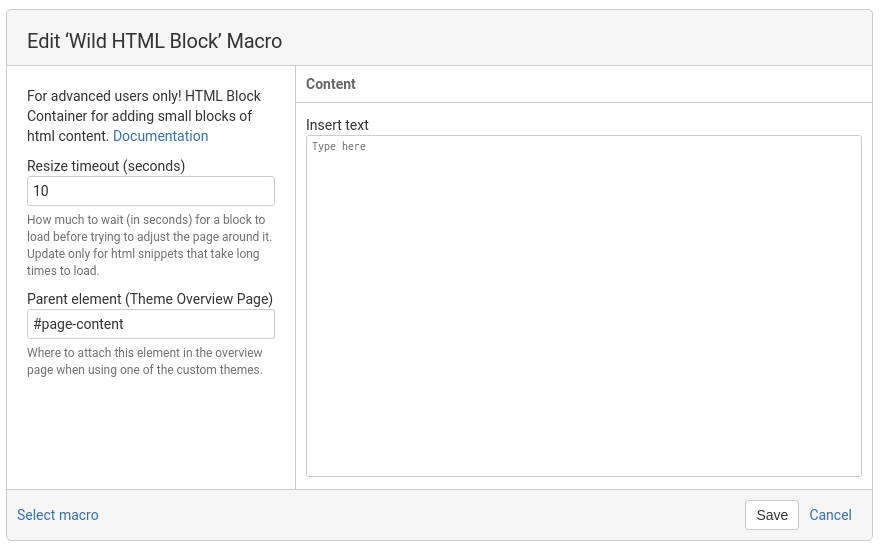
Enter your html code in the right side input and press Save. Your content will render after you publish the page.

Example - include custom js

Render a custom d3 graph from https://www.d3-graph-gallery.com/graph/histogram_double.html (We would like to thank the author for his work)

 Show me the code!
<!-- Create a div where the graph will take place -->
<div id="my_dataviz"></div>
<script>
var url = "https://d3js.org/d3.v4.js";
<!-- Load d3.js -->
$.getScript( url, function() {
// set the dimensions and margins of the graph
var margin = {top: 10, right: 30, bottom: 30, left: 40},
    width = 460 - margin.left - margin.right,
    height = 400 - margin.top - margin.bottom;

// append the svg object to the body of the page
var svg = d3.select("#my_dataviz")
  .append("svg")
    .attr("width", width + margin.left + margin.right)
    .attr("height", height + margin.top + margin.bottom)
  .append("g")
    .attr("transform",
          "translate(" + margin.left + "," + margin.top + ")");

// get the data
d3.csv("https://raw.githubusercontent.com/holtzy/D3-graph-gallery/master/DATA/data_doubleHist.csv", function(data) {

  // X axis: scale and draw:
  var x = d3.scaleLinear()
      .domain([-4,9])     // can use this instead of 1000 to have the max of data: d3.max(data, function(d) { return +d.price })
      .range([0, width]);
  svg.append("g")
      .attr("transform", "translate(0," + height + ")")
      .call(d3.axisBottom(x));

  // set the parameters for the histogram
  var histogram = d3.histogram()
      .value(function(d) { return +d.value; })   // I need to give the vector of value
      .domain(x.domain())  // then the domain of the graphic
      .thresholds(x.ticks(40)); // then the numbers of bins

  // And apply twice this function to data to get the bins.
  var bins1 = histogram(data.filter( function(d){return d.type === "variable 1"} ));
  var bins2 = histogram(data.filter( function(d){return d.type === "variable 2"} ));

  // Y axis: scale and draw:
  var y = d3.scaleLinear()
      .range([height, 0]);
      y.domain([0, d3.max(bins1, function(d) { return d.length; })]);   // d3.hist has to be called before the Y axis obviously
  svg.append("g")
      .call(d3.axisLeft(y));

  // append the bars for series 1
  svg.selectAll("rect")
      .data(bins1)
      .enter()
      .append("rect")
        .attr("x", 1)
        .attr("transform", function(d) { return "translate(" + x(d.x0) + "," + y(d.length) + ")"; })
        .attr("width", function(d) { return x(d.x1) - x(d.x0) -1 ; })
        .attr("height", function(d) { return height - y(d.length); })
        .style("fill", "#69b3a2")
        .style("opacity", 0.6)

  // append the bars for series 2
  svg.selectAll("rect2")
      .data(bins2)
      .enter()
      .append("rect")
        .attr("x", 1)
        .attr("transform", function(d) { return "translate(" + x(d.x0) + "," + y(d.length) + ")"; })
        .attr("width", function(d) { return x(d.x1) - x(d.x0) -1 ; })
        .attr("height", function(d) { return height - y(d.length); })
        .style("fill", "#404080")
        .style("opacity", 0.6)

  // Handmade legend
  svg.append("circle").attr("cx",300).attr("cy",30).attr("r", 6).style("fill", "#69b3a2")
  svg.append("circle").attr("cx",300).attr("cy",60).attr("r", 6).style("fill", "#404080")
  svg.append("text").attr("x", 320).attr("y", 30).text("variable A").style("font-size", "15px").attr("alignment-baseline","middle")
  svg.append("text").attr("x", 320).attr("y", 60).text("variable B").style("font-size", "15px").attr("alignment-baseline","middle")

});
});
</script>

How it works

Macro in regular page

Macro in Space Overview page (Custom theme)

Instance count

Multiple instances can be used inside a single page.

1 instance per custom theme overview page can be used

Technical details

Each macro is rendered inside an iframe element as it’s supported by Atlassians extension mechanism. The contained code is not permitted to alter or extend other functionalities present in the page

Content from the iframe will be extracted and appended to the page, it can alter content that is not rendered in iframes (special macros might be rendered in iframes)

About

Color codes make your life easier when grouping content. Why not organize your spaces according to color codes you could better identify the scope, target audience or some other custom criteria.

With the help of the themes pack you can easily adjust the general look and feel of your spaces with some new custom color schemes based on popular color pairs.

Read more details about enhanced customization options we allow via our "Pimp my space" program in the documentation space.


Flavors

Themes - Square Corners

Themes - Round Corners


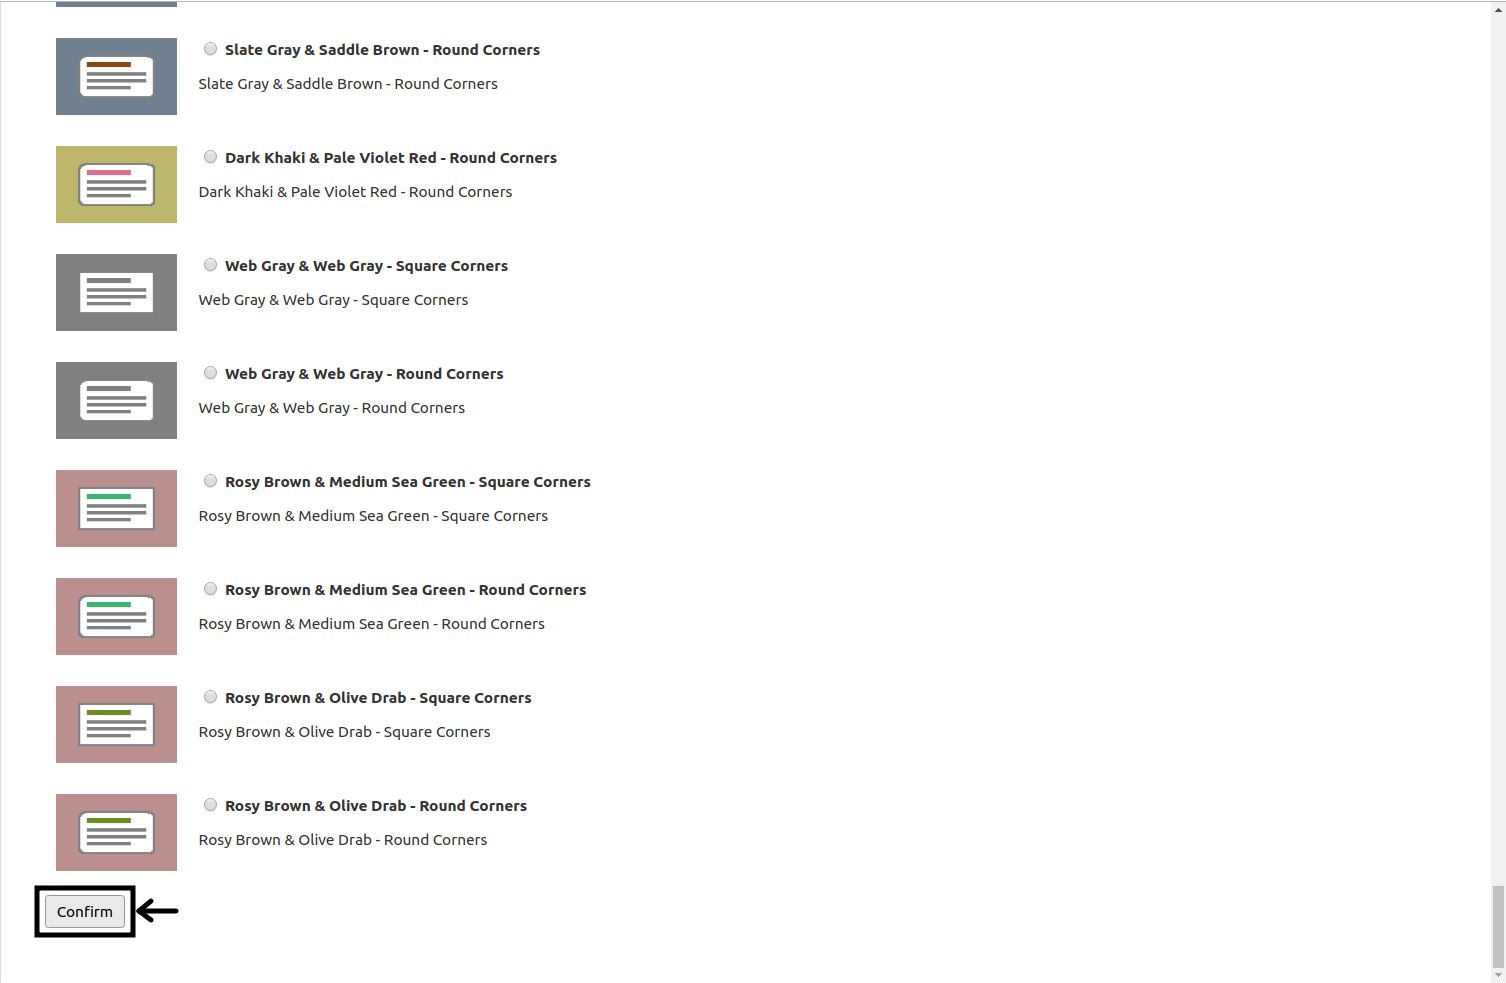
Selecting a new theme


Theme selection can be performed from the space settings screen.

Open the Space Settings page by clicking the corresponding menu entry.


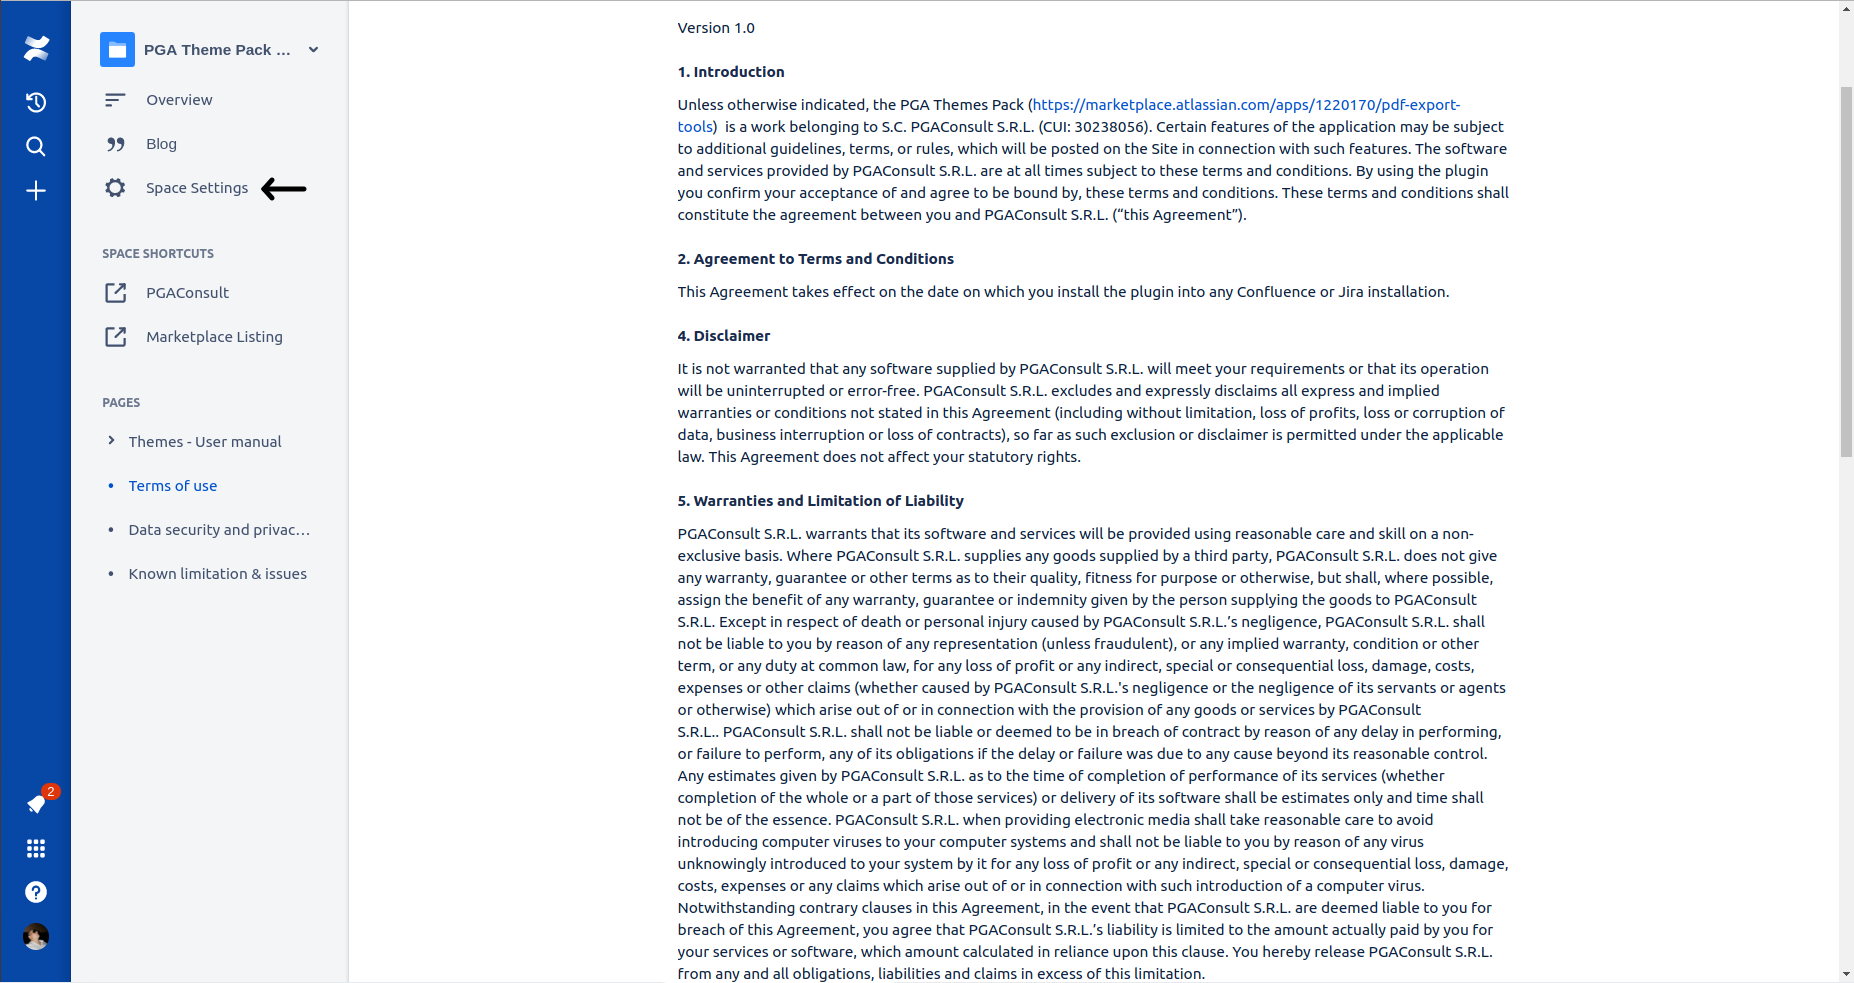
Please navigate to Look and Feel page and click the Themes tab. Now you can select any theme that will fit your color schemes.


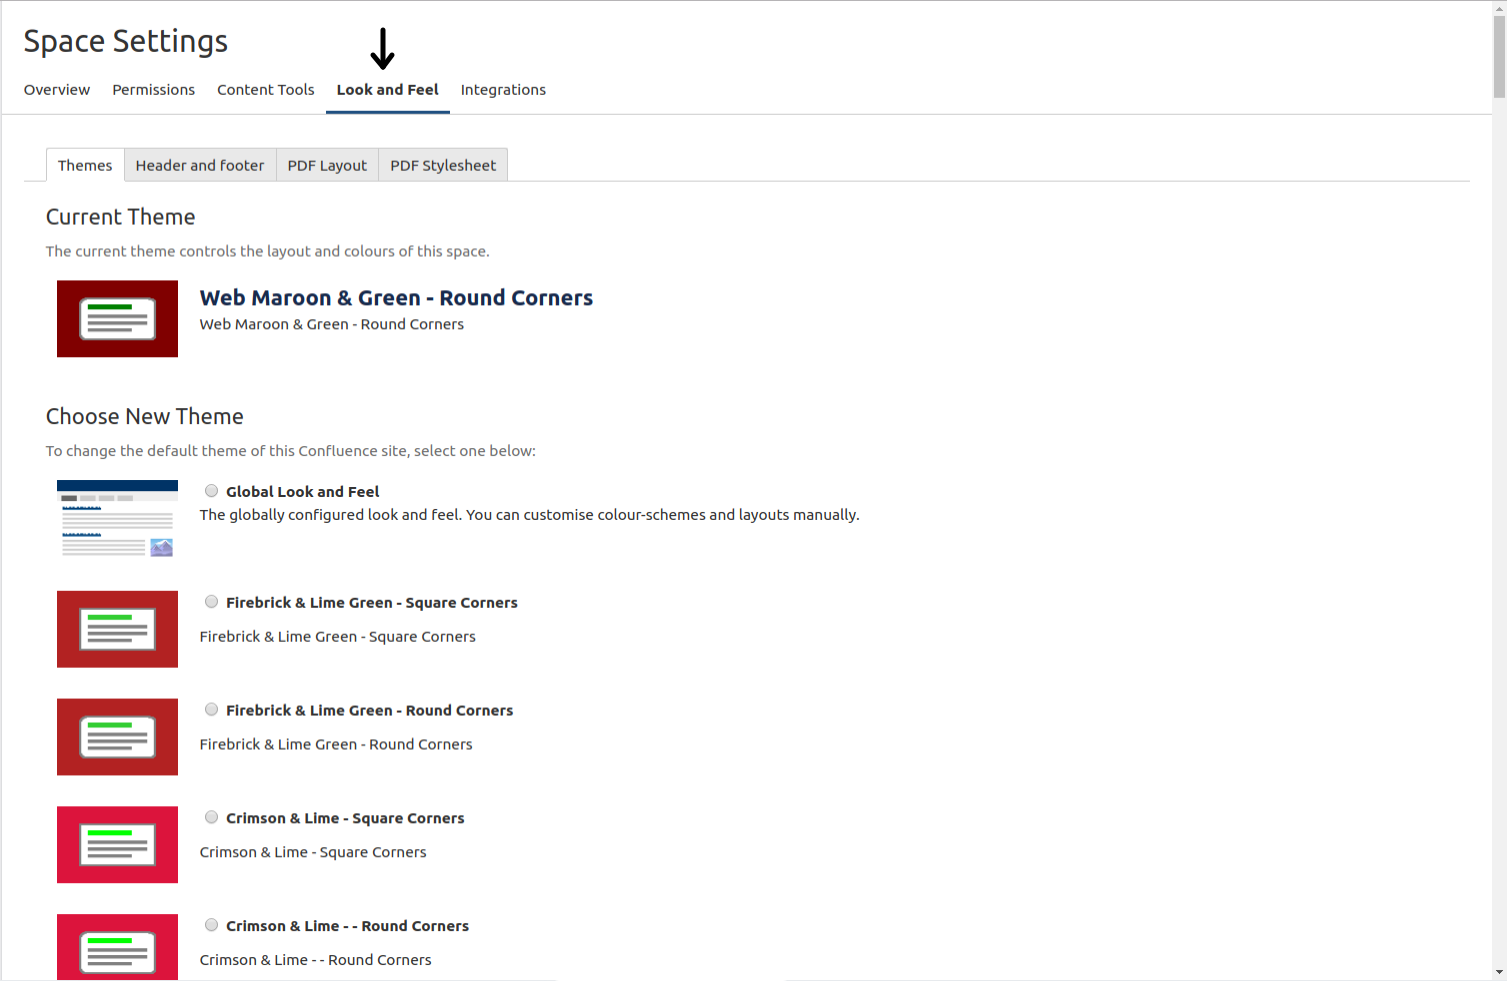
Please confirm the selection of a theme by pressing the Confirm button located at the bottom of the page.